Metrics Dashboards

There are two Tableau workbooks to support evaluation of CTE program portfolios at the college, district, micro-region, region and state level. All data comes from LaunchBoard. 

Workbook A

Compare a Single Program Across Multiple Locations

Questions you might use this workbook to answer:

  • How does the overall performance of a program at my college compare to the performance of the same programs at other community colleges within my region?
  • Which community college has the Child Development program with the highest number of students reaching a livable wage?
  • Which colleges have the highest percentage of students reaching livable wage? 

Workbook B

Compare Multiple Programs Across a Single Location

Questions you might use this workbook to answer:

  • What programs within the Advanced Manufacturing sector in the North region have the highest enrollments?
  • Which have the most students reaching a livable wage? Have the top wages?
  • Which programs within my college have the most students reaching a livable wage? How does the average earnings of program leavers compare across the programs at our college? 

Frequently Asked Questions

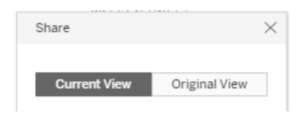
You can obtain the URL for any dashboard by copying the link that is produced when you click the Share icon.  

 You will have the option to share the current view (with your filters) or the original view (default). 

To download an image, PDF, or slide, click the Download icon. Icons in the lower right corner.

Count – Metric where only the value is available

Ratio – Metric where the value and denominator is available

Dollars – Metric where the value is measured in dollars

Median – Metric where the value is measured as an average median